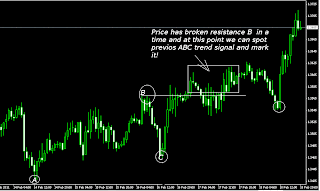
ABC analysis is basic reading of UP trend or Down trend!
It is very simple and powerful method!
First thing that you need to do is to detect UP trend or Down trend!
UP trend!
STEP 1.
Find minimum of UP trend (minimum price on your screen you are watching) and mark it with a letter A!
Find next maximum (first maximum after A) and mark it with a letter B!
AFTER B find new higher minimum than A and mark it with a letter C as on picture number 1!
Picture number 1
Picture number 2
You can help your self with ZigZag indicator to see the lines on your chart.
Picture number 3
Now you can add numbers to your HIGHER HIGHS (marks B) and to your HIGHER LOWS (marks C)
Picture number 4
I know that it can be confusing to spot right Bs and Cs because of mini-trends! If you take a better look you will spot that there is ABC configuration between A an B1 and that is a mini-trend! There is also one mini-trend between C1 and B2! I will mark them with lower case letters abc so you can spot them!
Picture number 5
When you look at your screen try to find only 4 to 7 essential spots for marking them with ABC method!


 2:15 AM
 Denis
Denis


0 comments:
Post a Comment