RIGHT TIMING is everything!
FIRST THING that you need to do before opening the FX charts is to check the time and study ECONOMIC CALENDAR for news releases!
If you are an intraday trader and you use small time frames from 1h to 1min for your analysis then you need to pay attention to time analysis even more than daily traders!
Why we need to pay attention on a time?
I will try to explain this. Price movement on the market is always logical!
If you see an uptrend it is quite logical that mass will try to buy at support and sell at resistance.
If you expect news to be published then your trading setup will be quite logical!
Your setup will depend on the news!
If you take in consideration that news traders don't care about previous trend direction then you will understand that news can push the price in either direction, desirable or contra trend.
It would be best to avoid times when news are released because it is not the same logic with the trend direction! You can check in ECONOMIC CALENDAR for news publishing schedule. You will find out when (exact time) to expect those news with high, medium and low impact on the market.
News released about GBP will affect all currency pairs related with GBP and news about EUR will affect all currency pairs related with EUR, etc. If you are trend trader then it would be best not to trade 15min to half an hour before and after news release.
There is another time impact on the market that you can predict and it has own logic which is not related with trend trading logic. First hour of market opening! Why first hour of market opening has it's own trading logic which is best to avoid? It is known that on every stock market first hour is closed for live trading because it is dedicated for pending contracts and those contracts do not care about trend. Stock market and FOREX are in correlation.
Next TIME impact is market closing! If you have ever heard for most popular expression LONDON FIX.
Time before LONDON close (LONDON FIX) ,NEW YORK close (AMERICAN SESSION OVER) and ASIAN close is logical! Intraday traders are closing their positions and they are going home because their working day is over! We have also swing traders which will close their positions on Friday because of weekend. It is known that when market starts operating (first hour) after weekend we can expect the GAP to show up. Traders who use large leverage are scared of that GAP because every broker does not guaranty for pending order to fill. Gap can go over stop loss order and trader can lose even more than he/she has limited.
There is one more thing when we speak about TIME analysis!
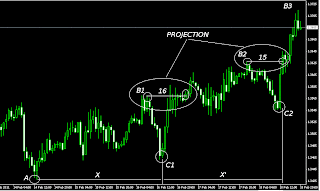
It is about technical approach but first look at the picture below:
On the picture you can see UP trend! I have marked LOWS because those lows are considered as MOF spots in UP trend!
MOF- Money On the Floor!
You must take in consideration number of time periods X between MOF spots so you can make time projection X'. Why is that important?
It is very important to know when to expect the move on the market because it brings you the patience!
On the second picture you can see time analysis of break trough high B1! I didn't take in considerations those shadows as a break trough but I have wait for candle to close above that resistance line and we can see that it needed 16 time periods (candlesticks) to break this resistance. When I project this to new higher high B2 we have almost same story. For breaking B2 resistance we needed 15 time periods (candlesticks).
What if price accomplish our goal to early?
Answer to that question is trend is accelerating unless there was time impact of another character like news release or session opening maybe fat finger...
What if price does not accomplish our goal at the time?
That means that trend is probably slowing down and you need to find your way out!
What if price goes against our goal?
There is no panic! That is why you have a stop loss order!
When we speak about time, I must mention that there are few different trends according to time:
LONG therm trends- Investors holding their position from 2 or 3 months to 1 year!
MEDIUM therm trends- 3 or 5 days to 2 or 3 months!
SHORT therm trends- Intraday traders holding their positions from few hours to 5 days (1 week)!
SCALPING- few minutes till one or two hours!
All of them are behaving as ONE!
When you make your analysis always start with large time frame and then slowly zoom in with lower time frames! That way you will first see the forest then one sector of the forest and after that you can search for your perfect tree!


 9:39 AM
 Denis
Denis


0 comments:
Post a Comment